

Today I am going to provide an overview of the Page Analyzer Report dashboards in Sitecore CDP. Page Analyzer Report is newly added to the Sitecore CDP platform. It is a new feature that is designed to enhance the understanding of user behavior and page performance within Sitecore CDP.
Sitecore CDP is an enterprise-level customer data platform that helps various businesses manage and lift their customer data to drive better customer personalization and experiences. The Sitecore CDP is designed to provide an exceptional experience to every individual on all digital channels. The functionality of CDP's data management is augmented with decisions, predictive analytics, experimentation, and orchestration.
Organizations are constantly searching for new and different ways to leverage the potential value of their customer data in today's data-driven environment with the goal of obtaining valuable information and making educated choices. Sitecore CDP provides you with a centralized location for storing all of your customer data, allowing you to unify, clean, and enhance it for effective analysis. The dashboard feature of Sitecore CDP enables you to concisely observe and analyze your customer data within Sitecore CDP.
The Page Analyzer Report dashboard visualizes and provides insights about the actual customer behavior and individual page performance using comprehensive data analysis from the data that is ingested by Sitecore CDP. It is designed to map out customer journeys through visualization of user-traffic patterns and navigation behaviors to identify key trends and areas for improvement.
Marketers or Business Users can use these reports to gain insights into the users’ journeys and allow them to optimize marketing strategies and improve landing page effectiveness. It also allows them to trace the routes leading to conversions and understand the steps users take before achieving specific goals.
The data of the Page Analyzer Report is refreshed after every 24 hours. Organizations can use the filters available in the Page Analyzer Report to select the time frame, channels, page, and view to display the data. The default view shows the data for the past month, with no specific channel.
Customer Journey Report
.png)
The Customer Journey report is represented as a Sankey diagram that visually represents the user navigation patterns across the website. It can display up to 20 distinct nodes and each node represents a different page in the user journey. This graph highlights the various routes taken by users on the website which makes it easier to understand user movement between the pages. It lets you identify the underperforming or low-traffic pages align you with your business goals and implement strategic actions to enhance website performance.
The graph also traces the paths from one page to another, with each path distinguished by a distinct color. When the mouse is hovered over a specific path on the graph then it becomes highlighted, and a tooltip appears that provides the data regarding user traffic on that route. Similarly, when the mouse is hovered over an individual node on the graph then it becomes highlighted, and a tooltip appears that provides the page name and the number of views. Additionally, the graph will also highlight all the incoming and outgoing connections linked to the node that provide a view of user traffic to and from that particular page.
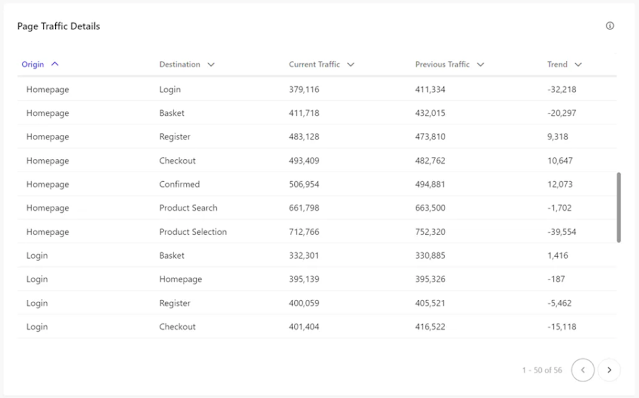
Page Traffic Details Report
.png)
This table represents the breakdown of the website traffic in terms of user transitions between different pages. It specifically tracks the user’s movement from an origin page to a destination page. The table also includes a Trend column, which compares current traffic metrics with those from the previous period. To sort a column by name or count just click on the column heading.
Along with all these graph views you also get options to update the Page Analyzer Report based on the filters. You can also download the report as a ZIP file containing the CSV files.
References
Dashboards in Sitecore CDP - https://doc.sitecore.com/cdp/en/users/sitecore-cdp/dashboards-in-sitecore-cdp.html
Page Analyzer Report in Sitecore CDP - https://doc.sitecore.com/cdp/en/users/sitecore-cdp/page-analyzer.html
That’s All for Today,
Happy
Coding
Coders
for Life